ISEE Student Growth Percentiles
Test Innovators2022-05-13T17:23:50-07:00A Note from Test Innovators’ CEO, Edan Shahar
To date, students have answered over 20 million questions on the Test Innovators platform. Now, we are diving into this data to understand how students learn and to help them achieve their academic and test-taking goals.
Our new Data Science team will be providing actionable analysis and creating cutting-edge features and tools to help our students, our schools, and our tutoring partners better understand the learning process.
We’re thrilled for what’s coming down the pipe… stay tuned.
Improvement from Test to Test
We know that students use our platform to improve their test scores, but we wanted to know exactly how much they improve. We started by looking at student percentiles from test to test to capture the trajectory of student performance.
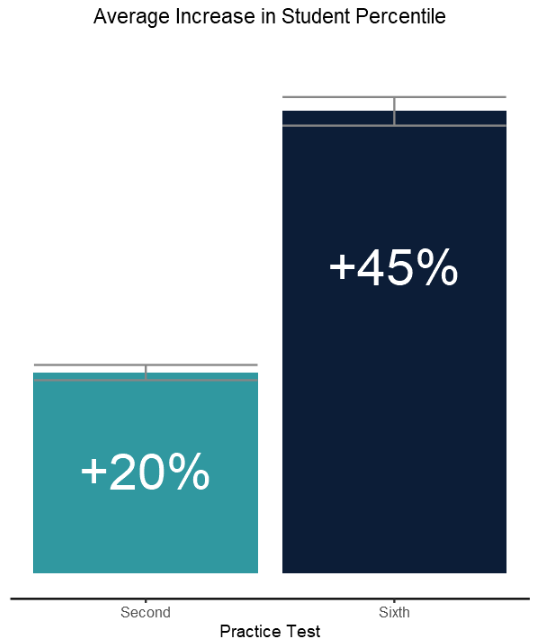
Figure 1 depicts the average increase in student percentile compared to the students percentile score achieved on the first practice test. The light blue bar represents the increase in percentile after the second practice test and the dark blue bar represents the increase in percentile after the sixth practice test. Error bars represent the 95% confidence interval.
Across our platform, students exhibit statistically significant increases in test percentile after every practice test. We see that our students don’t just improve by using our platform, but they improve consistently over time, further reinforcing that practice makes perfect. Students who use the Test Innovators platform see a 20% increase in percentile after just the second practice test. Students who complete our Valedictorian package and take all six tests see a 45% increase in percentile.
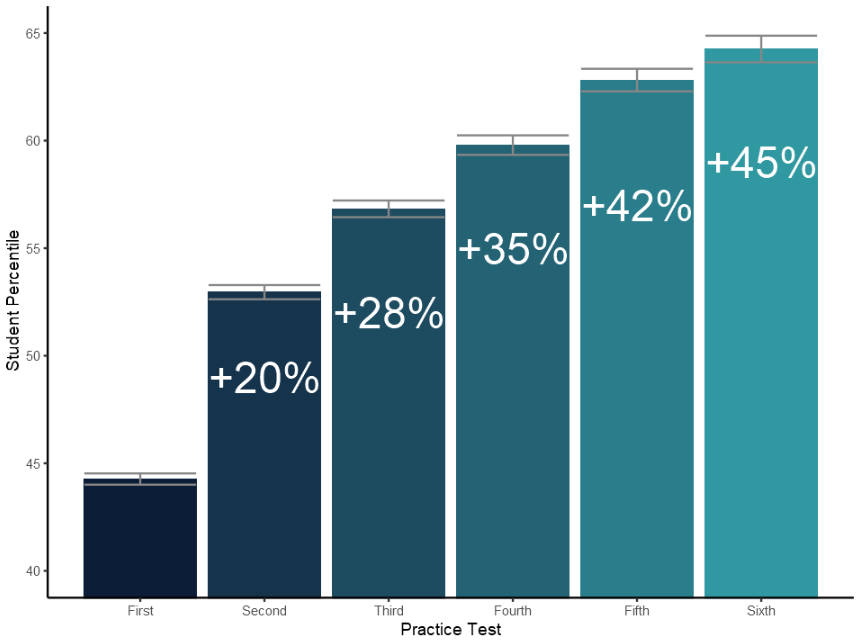
Figure 2 shows average achieved percentiles on each test (1-6). We observe a statistically significant increase after each test iteration. The values in each bar correspond to the percent increase in percentile relative to the first exam (far-left bar).
Based on this information, we stand by our recommendation for students to complete all of the practice tests available to them. However, if you don’t have time for all of the practice tests, completing just two practice tests has a significant positive impact on scores.
Improvement by Section
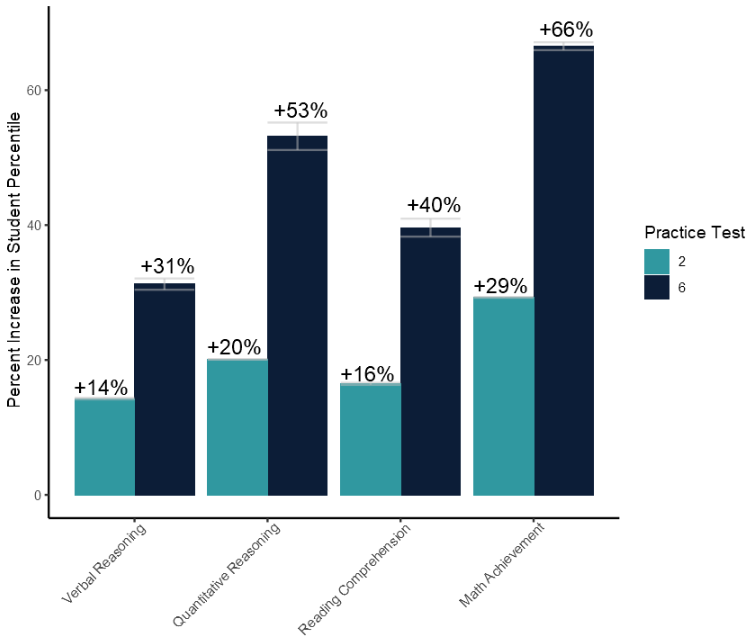
Figure 3 displays the average increase in student percentile compared to the students percentile score achieved on the first practice test disaggregated by test section subject. The light blue bar represents the increase in percentile after the second practice test and the dark blue bar represents the increase in percentile after the sixth practice test. Error bars represent the 95% confidence interval.
Seeing how much students improve from test to test wasn’t enough for us. We wanted to learn more about how our students improve in each section of the test. When we analyzed improvement by section, we discovered that after the second practice test our students, on average, see a 14% increase in Verbal, a 20% increase in Quantitative, a 16% increase in Reading, and a 29% increase in Math.
By the time our students complete their sixth practice test, they see a 31% increase in Verbal, a 53% increase in Quantitative, a 40% increase in Reading, and a 66% increase in Math.
Improvement by Level
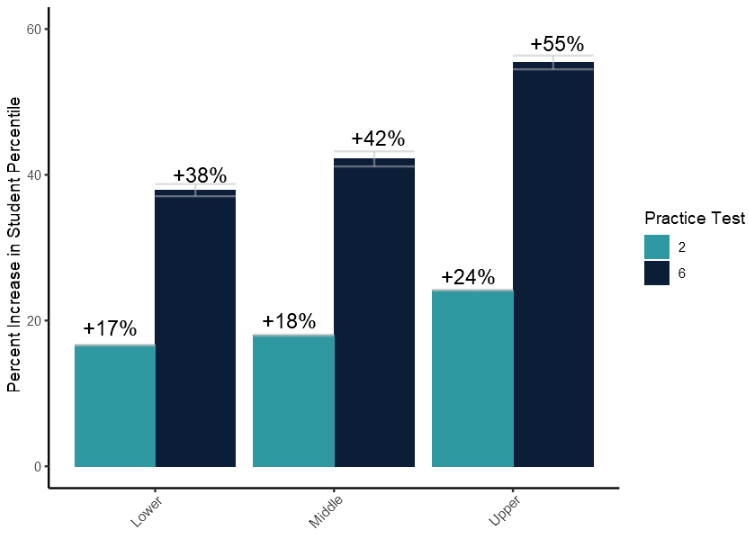
Figure 4 displays the average increase in student percentile compared to the students percentile score achieved on the first practice test disaggregated by student level. The light blue bar represents the increase in percentile after the second practice test and the dark blue bar represents the increase in percentile after the sixth practice test. Error bars represent the 95% confidence interval.
Finally, we studied how students within each level of the test improved. We discovered that students at the Primary Level see a 12% increase after the second test and a 45% increase after the sixth test; students at the Lower Level see a 17% increase after the second test and a 38% increase after the sixth practice test; students at the Middle Level see an 18% increase after the second test and a 42% increase after the sixth test; and students at the Upper Level see a 24% increase after the second test and a 55% increase after the sixth test.
Student Growth Percentile
At Test Innovators, we help students improve their scores through personalized practice plans. These individualized plans require a holistic approach and a comprehensive picture of each student’s ability.
Traditionally, test prep companies have viewed performance as the single most important metric, but we are also interested in measuring individual student growth. Year-to-year growth measures, like student growth percentiles (SGPs), are routinely utilized at the state, district, and school levels as a key performance indicator alongside student academic performance. Student growth percentiles measure a student’s level of growth compared to other students of similar academic performance.
To learn more about student growth percentiles, visit our Student Growth Percentiles FAQ.
We have modified the SGP metric to quantify an individual student’s test-to-test growth relative to other students on our platform. By combining performance and growth metrics, we can better determine what students need to practice in order to succeed on test day.
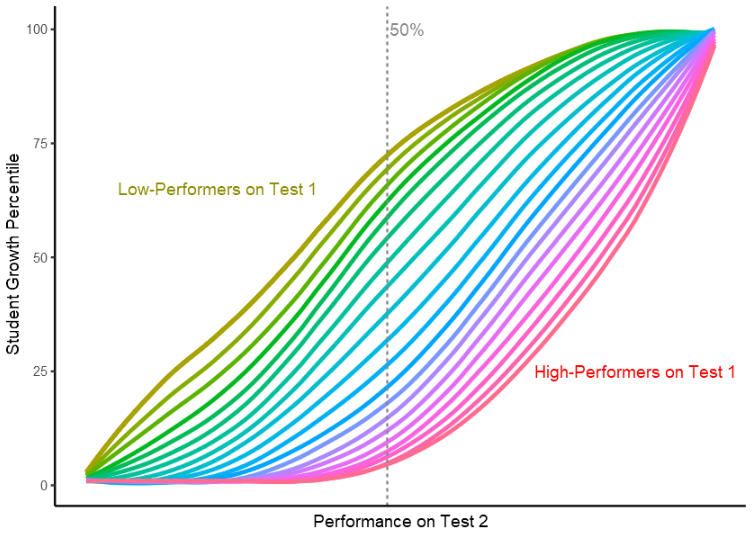
Figure 5 depicts multiple student growth percentile curves. The y-axis displays the student growth percentile value (ranging from 1st-99th). The x-axis represents the raw score achieved on a students second test. Each colored line corresponds to a possible raw score on a previous test (here test 1). The curves are arranged from low- (left) to high- (right) performers. For example, the yellow curve (low-performer) will need to score lower on test 2 than the red curve (high-performer) in order to receive the same student growth percentile score. This is because we have different score expectations for high-performers and low-performers. The grey dashed line represents a 50% estimate of the raw score of Test 2.
The above graph depicts how student growth percentiles work. In this example, a student’s score on Test 1 will determine his/her curve color (yellow represents the lowest score possible and red represents the highest score possible). Next, the student’s performance on Test 2 (the x-axis) will determine his/her student growth percentile. For example, if a ‘yellow-curve’ student scores a 50% on Test 2 (vertical dashed grey line), he/she would achieve a high student growth percentile, indicating above-average growth compared to other ‘yellow-curve’ students. On the other hand, if a ‘red-curve’ student scores a 50%, he/she would show below average growth because he/she scored significantly lower than other ‘red-curve’ students.
Student growth percentiles will play a large role in advancing our future analyses, both in terms of richness and complexity. For example, we will incorporate student growth percentiles alongside practice test percentiles to measure the effectiveness of various tools that our platform offers. Using this combination of metrics, we can also identify groups of similar students that can be targeted with specific interventions. By gaining a richer view of how students are learning, we can better gauge what they need to succeed.
A Note from Test Innovators’ Data Scientist, Sean Coffinger
Average percent increases in student percentiles were derived by comparing ISEE student percentiles from practice test 1 to practice tests 2 and 6, respectively, and by observing percent increases in the paired scores. Error bars represent 95% CI. All percentile increases between test iterations were statistically significant (alpha = .01). Percent increase is relative to initial practice test percentile and describes the average percent increase in section percentile. Percentiles are initially derived from raw scores.
Student growth percentiles were built using ISEE raw score data from test to test to construct a distribution of scores achieved for each previous score possibility. “Test to test” is defined as Test(n-1) to Test(n) and is not specific to the first and second test as exemplified in Figure 5. Ground truth distributions were then interpolated to fully model all potential outcomes. A second interpolation between previous score possibilities ensured the preservation of ordinality. Both interpolations were conducted using local regression and locally estimated scatterplot smoothing. SGP curves were built for each grade:subject:raw score(test n-1) combination. By definition, students are required to complete a minimum of two sections of the same grade to receive a SGP measure.
To see our data pertaining to SSAT students, visit our SSAT Student Growth Percentiles page.


